

The average SNAP benefit was $188.33 per person per month in fiscal year 2025, according to the latest complete federal fiscal-year figures published by the U.S. Department of Agriculture (USDA). That number is a nationwide average—not a standard payment and not a prediction of what will be loaded onto any one EBT card.
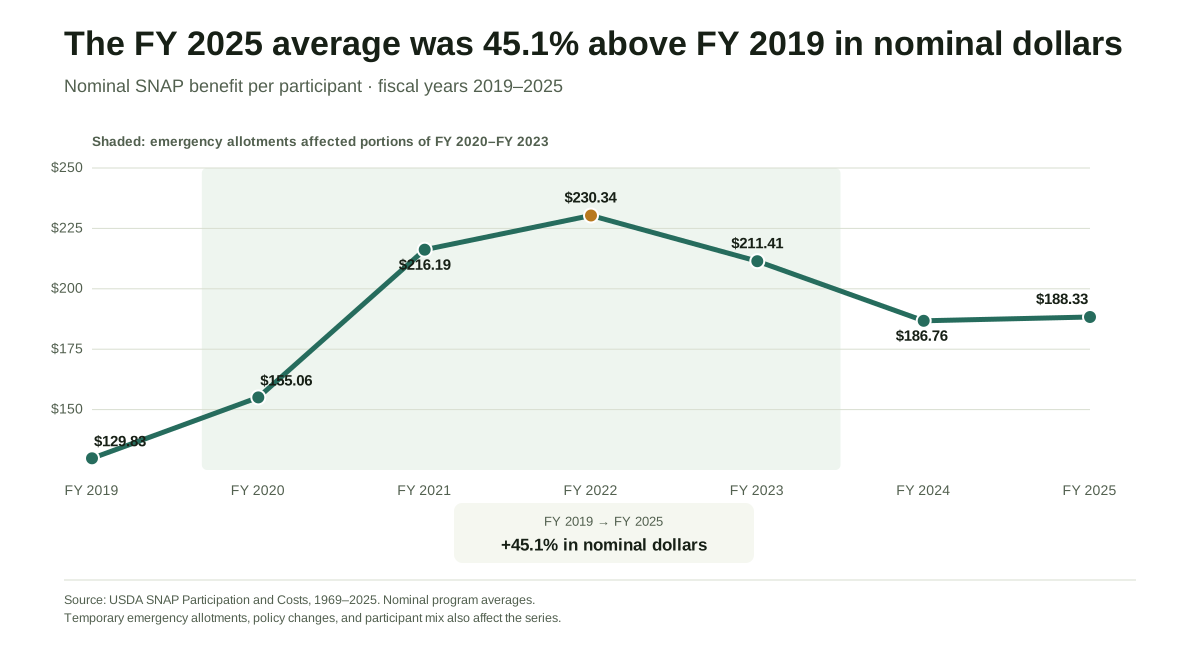
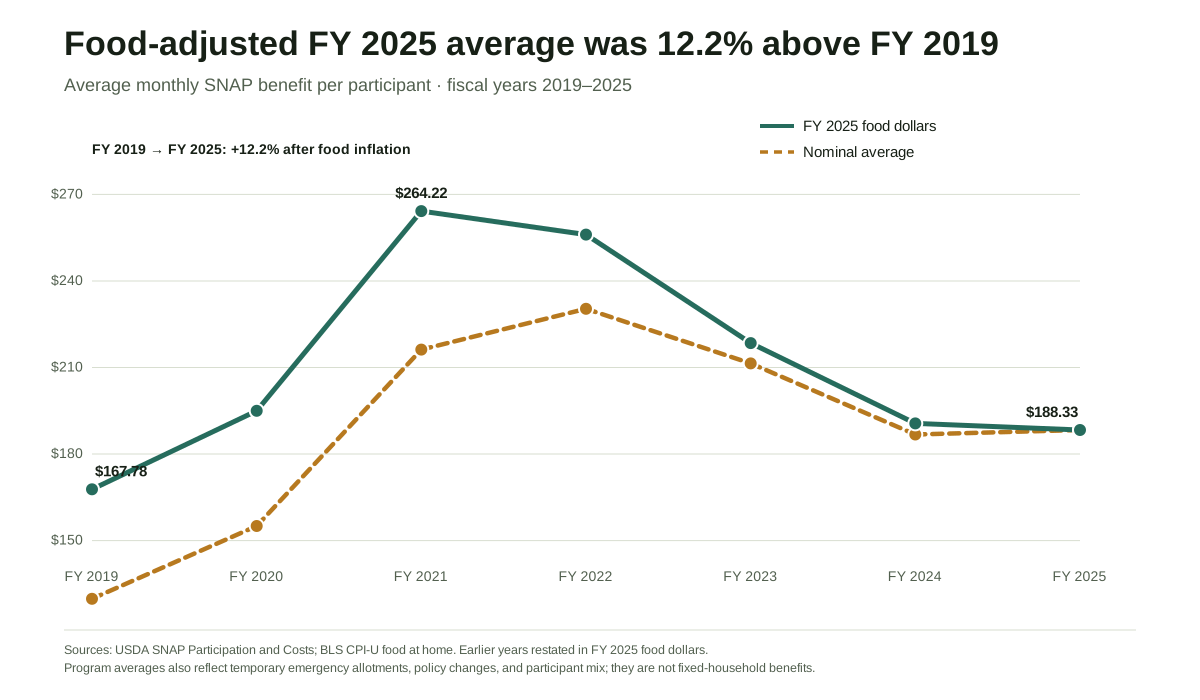
Compared with the last full pre-COVID fiscal year, the FY 2025 average was 45.1% higher than FY 2019 in nominal dollars and 12.2% higher after both amounts were expressed in FY 2025 food-at-home dollars. It was still 28.7% below the pandemic-era FY 2021 equivalent.
In a separate one-month comparison for November 2024, state program averages ranged from $162 per participant in Minnesota to $366 in Hawaii. That month overlapped with disaster-assistance operations in Georgia and South Carolina, which may have influenced some totals; none predicts any household's allotment.
Actual SNAP allotments vary with household size, net income, allowable deductions, location—particularly the separate schedules for Alaska and Hawaii—and sometimes disaster assistance.
For local deposit schedules and reviewed official account-access information, go directly to the state directory.
Why this matters to your grocery budget
An average benefit can look larger or smaller depending on the year, local food prices, and temporary emergency payments. Putting those pieces together shows whether the average kept pace at the grocery store—and prevents the unusually high pandemic-era figures from being mistaken for today's normal payment. This is context, not a benefit estimate: your own allotment still depends on your household's circumstances.
SNAP benefits at a glance
USDA's SNAP data tables show that in fiscal year 2025:
- SNAP served an average of about 42.4 million people each month.
- The average monthly benefit was $188.33 per participant.
- Approximately $95.8 billion in SNAP benefits was issued during the fiscal year.
A fiscal year runs from October through September. The FY 2025 figures cover October 2024 through September 2025 and were reported by USDA as of July 10, 2026. USDA notes that all program data remain subject to revision.
The national average rose during the pandemic period, then declined
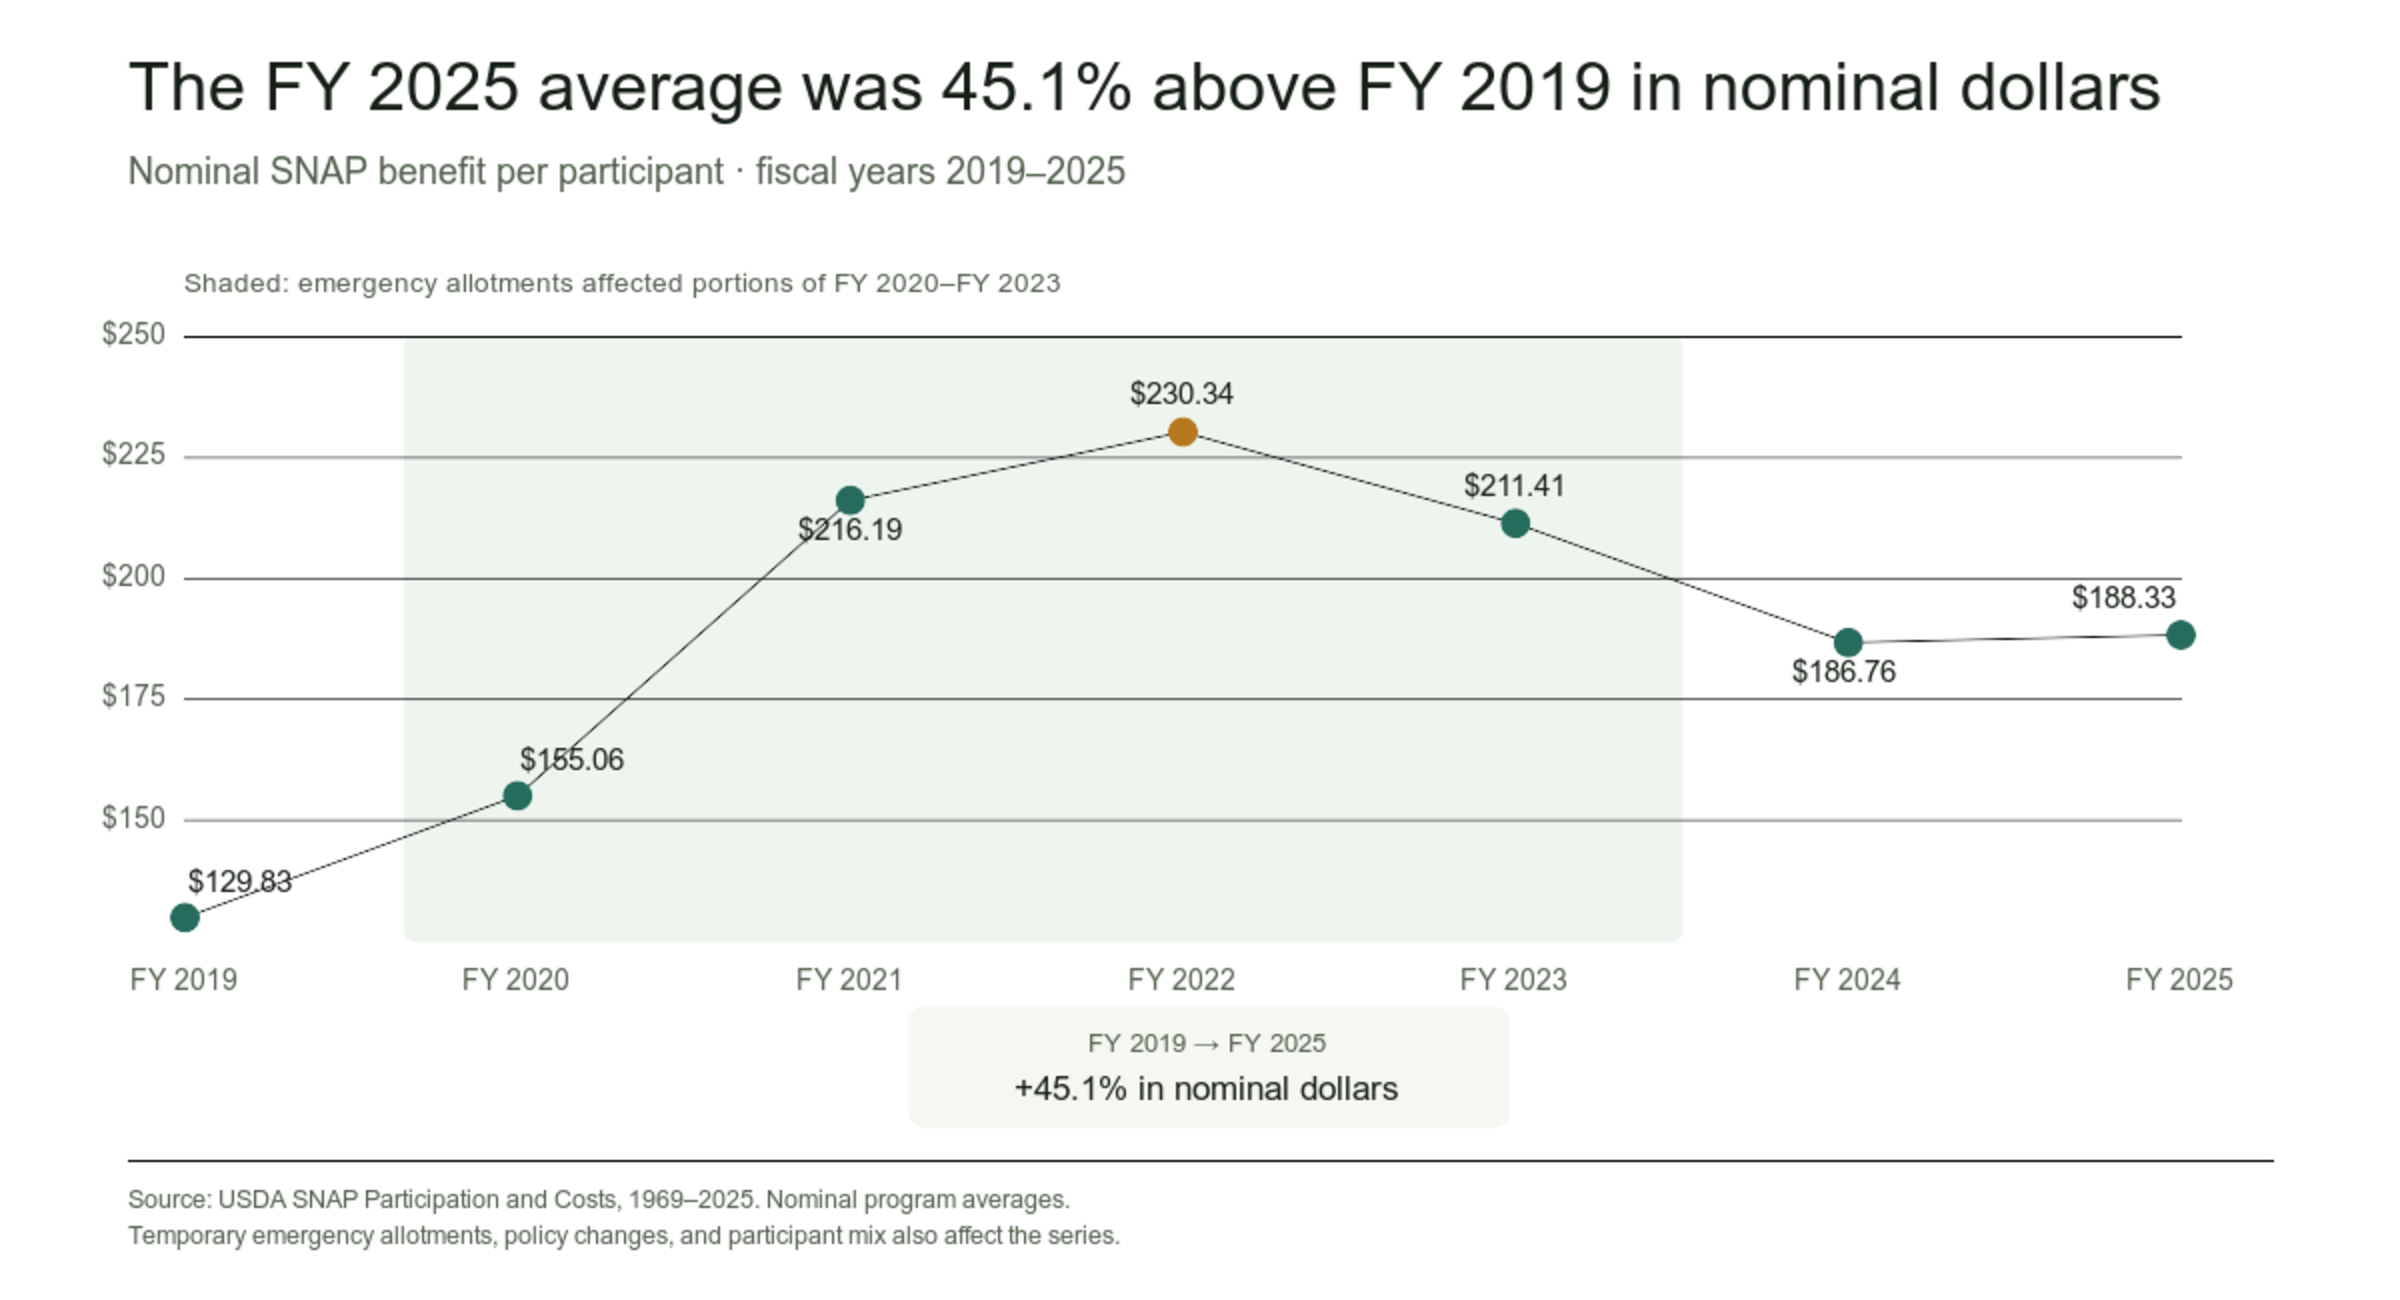
FY 2019 is the last complete federal fiscal year before the COVID-19 pandemic; FY 2020 covers October 2019 through September 2020 and includes pandemic months. The average monthly benefit per participant rose sharply during the pandemic period and has since moved lower. These are nominal dollars, meaning the figures have not been adjusted for inflation.

| Fiscal year | Average monthly participants | Average monthly benefit per person | Total benefits issued |
|---|---|---|---|
| 2019 | 35.7 million | $129.83 | $55.6 billion |
| 2020 | 39.9 million | $155.06 | $74.2 billion |
| 2021 | 41.6 million | $216.19 | $107.9 billion |
| 2022 | 41.2 million | $230.34 | $113.9 billion |
| 2023 | 42.2 million | $211.41 | $107.0 billion |
| 2024 | 41.7 million | $186.76 | $93.5 billion |
| 2025 | 42.4 million | $188.33 | $95.8 billion |
Source: USDA Food and Nutrition Administration, SNAP Participation and Costs, 1969–2025. Figures are rounded here; the calculations and conclusions use USDA's published values.
In nominal dollars, the national average in FY 2025 was 45.1% above FY 2019 but 18.2% below its FY 2022 peak. Neither comparison means every household's allotment changed by those percentages. The pandemic-era data included temporary emergency allotments, while a household's regular benefit depends on its own circumstances. Changes in who participated can also move the average even if program rules do not change.
Food inflation changes the comparison
Nominal dollars do not show how much food a benefit can buy. To make that comparison, we adjusted each fiscal year's average benefit with the Bureau of Labor Statistics' CPI-U index for food at home. Food at home is a closer match for SNAP purchasing power than the all-items CPI because SNAP generally pays for eligible grocery foods rather than rent, gasoline, or restaurant meals.
For each fiscal year, we averaged the 12 monthly food-at-home index values from October through September. We then expressed every year's benefit in FY 2025 food-at-home dollars.

| Fiscal year | Nominal average benefit | Average in FY 2025 food dollars | Year-over-year change in inflation-adjusted benefit |
|---|---|---|---|
| 2019 | $129.83 | $167.78 | — |
| 2020 | $155.06 | $194.98 | +16.2% |
| 2021 | $216.19 | $264.22 | +35.5% |
| 2022 | $230.34 | $256.06 | -3.1% |
| 2023 | $211.41 | $218.47 | -14.7% |
| 2024 | $186.76 | $190.63 | -12.7% |
| 2025 | $188.33 | $188.33 | -1.2% |
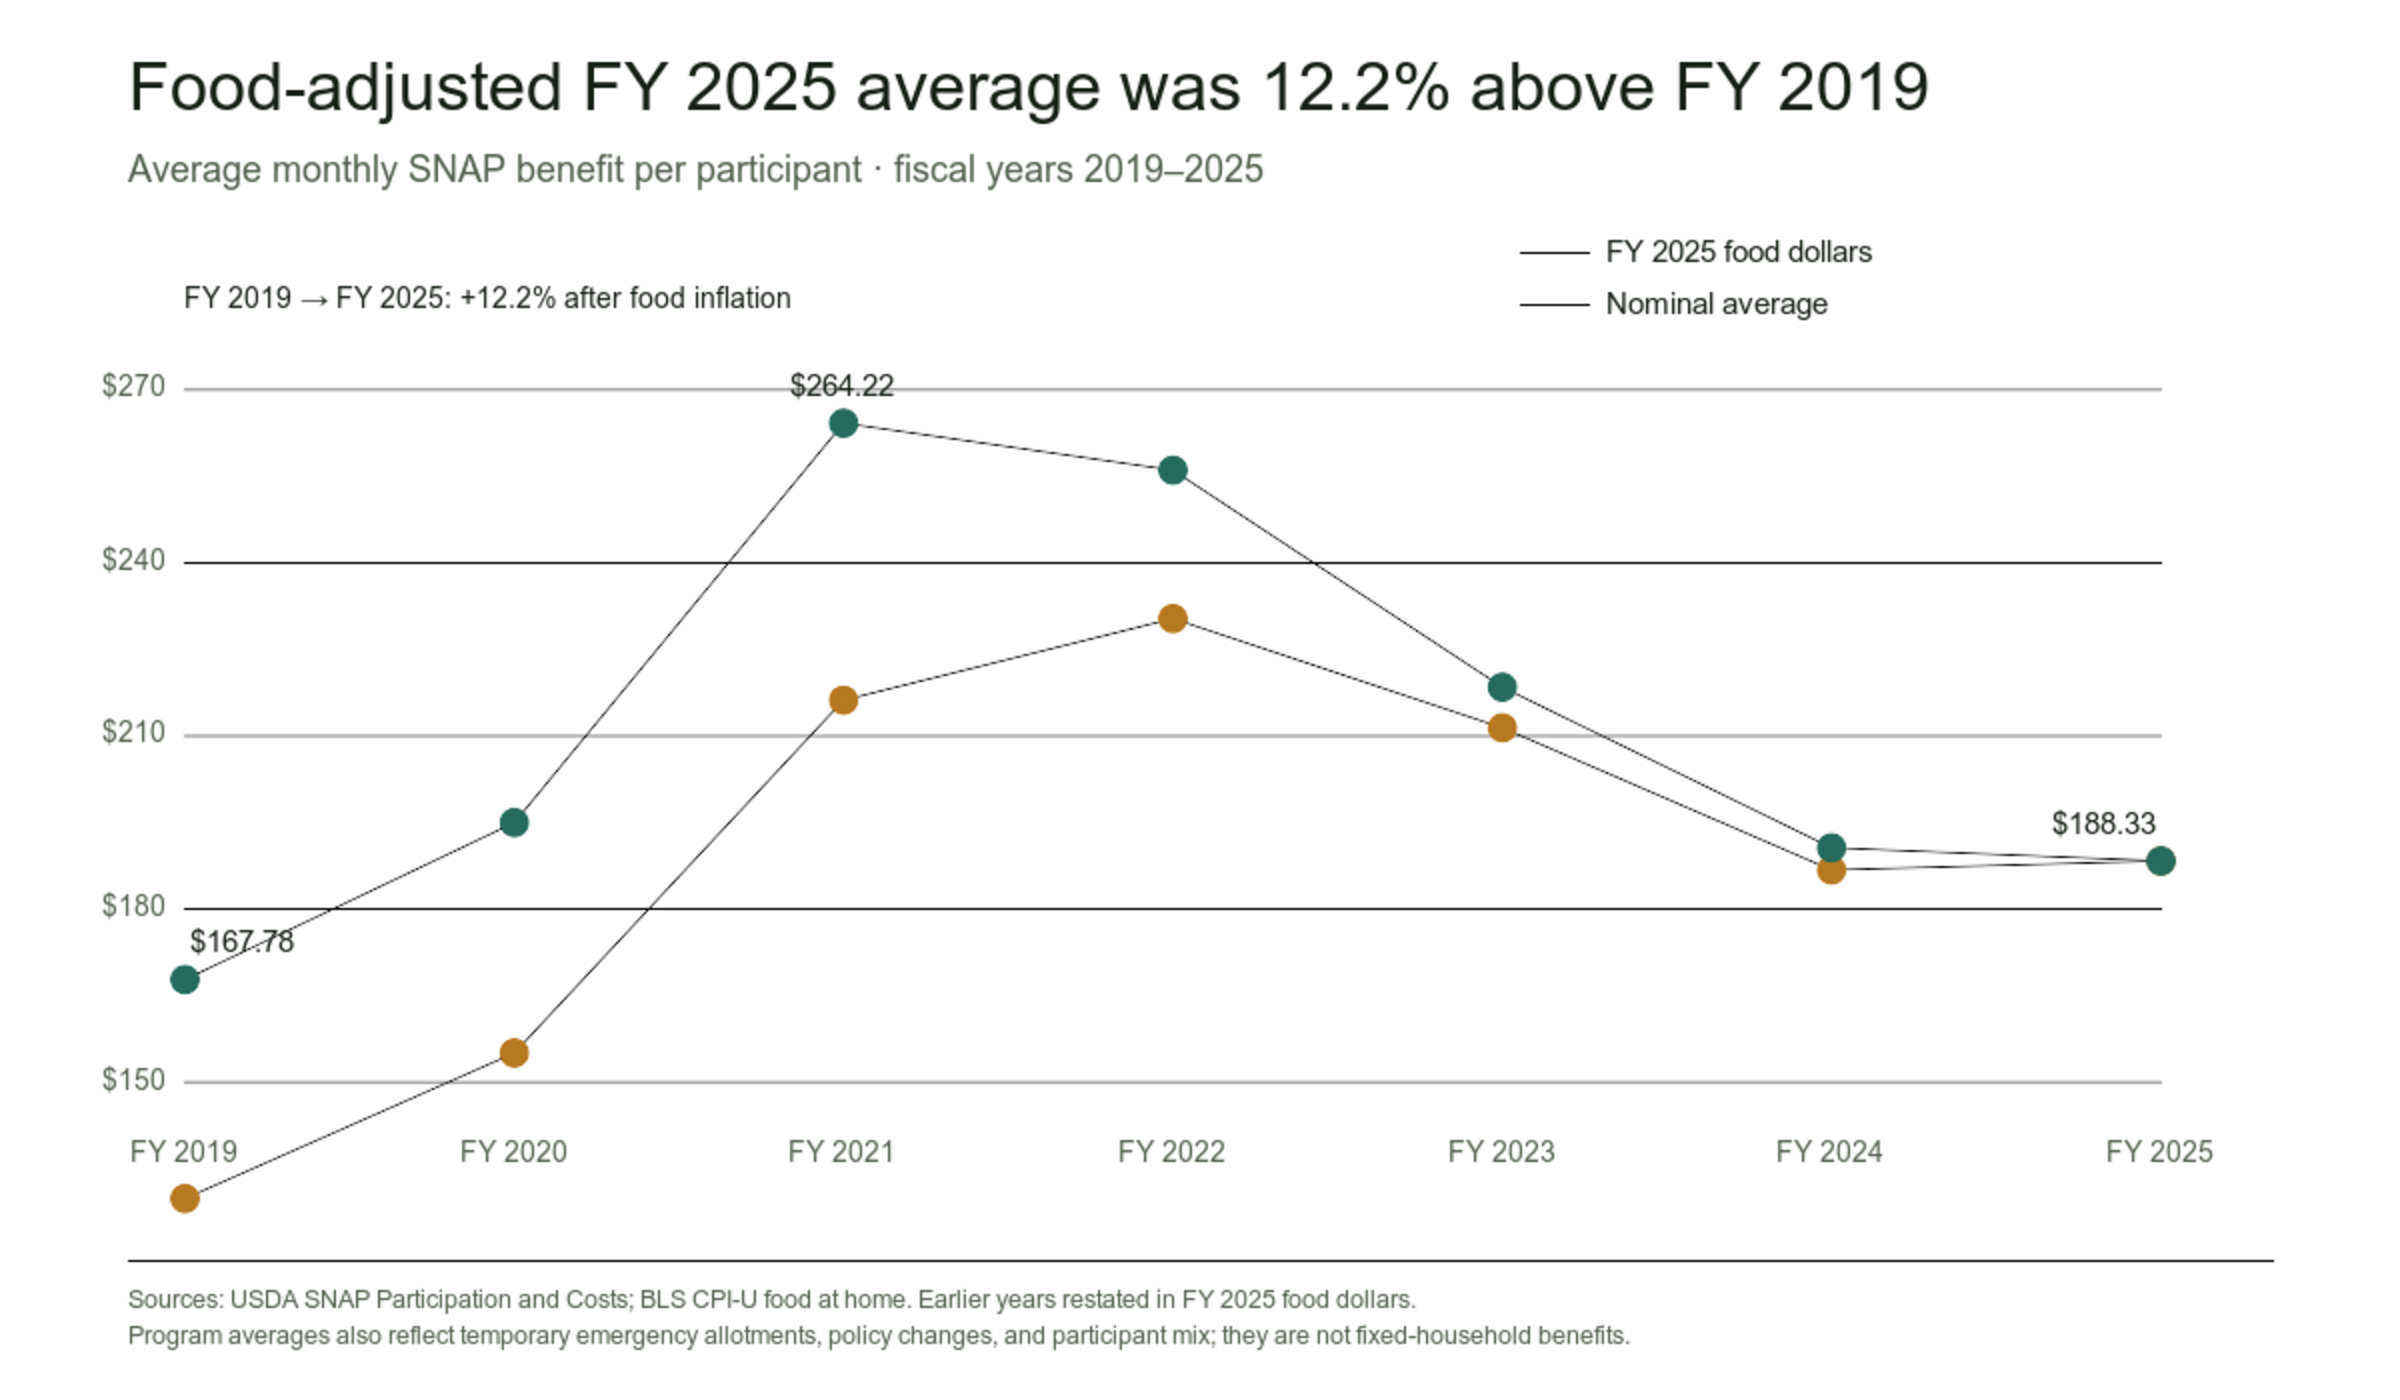
Compared with FY 2019, the nominal average was 45.1% higher in FY 2025. After adjusting for food-at-home inflation, it was 12.2% higher. The same FY 2025 average was 28.7% below the pandemic-era FY 2021 equivalent and 26.5% below the FY 2022 equivalent in food-dollar terms. Together, those comparisons show why the pre-COVID baseline and the temporary pandemic-era peak answer different questions.
Even the small increase from FY 2024 to FY 2025 did not keep pace with food prices. The nominal average rose 0.8%, while the fiscal-year food-at-home CPI average rose 2.1%, producing a 1.2% food-price-adjusted decline.
These figures describe program-wide averages, not the purchasing power of a fixed household. Emergency allotments, annual policy changes, and changes in the participating population all affect the benefit average. The adjustment answers a narrower question: what would each year's average be worth at FY 2025 grocery-price levels?
A state-by-state snapshot
Quick answer: Dividing combined November 2024 benefits for the 50 states and D.C. by their combined participant count yields $194.26 per participant. State values ranged from $162 in Minnesota to $366 in Hawaii. Alaska and Hawaii use separate allotment schedules; the month overlapped with disaster-assistance operations in Georgia and South Carolina, which may have contributed to their unusually high averages. These are one-month program averages, not household allotments or a ranking of generosity.
The following table uses November 2024 as a consistent state comparison. For each state and the District of Columbia, we calculated benefits issued ÷ participants for that month. Results are rounded to the nearest dollar.
We used November 2024 to provide a finalized month from USDA's complete FY 2025 archive. Newer state data are available, but in the release with data as of July 10, 2026, March 2026 is marked preliminary and April 2026 is marked initial. A one-month snapshot can reflect temporary issuance and should not be treated as a normal-month ranking.

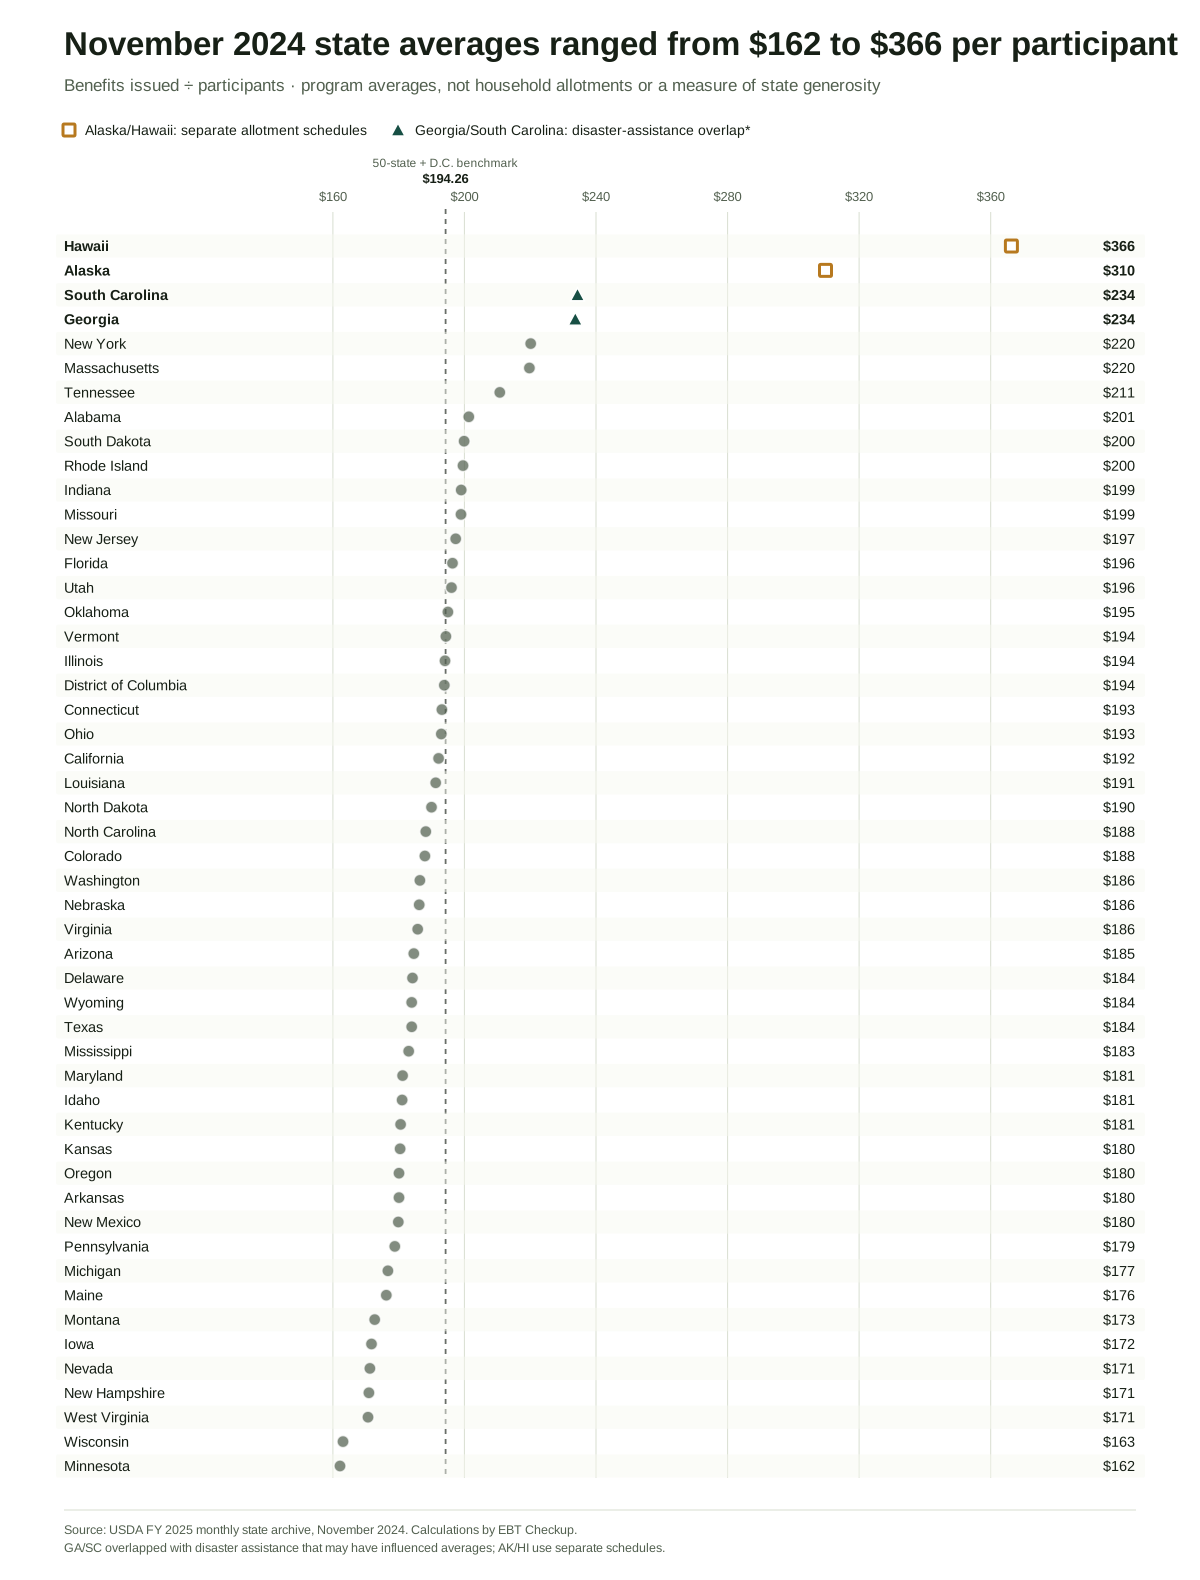
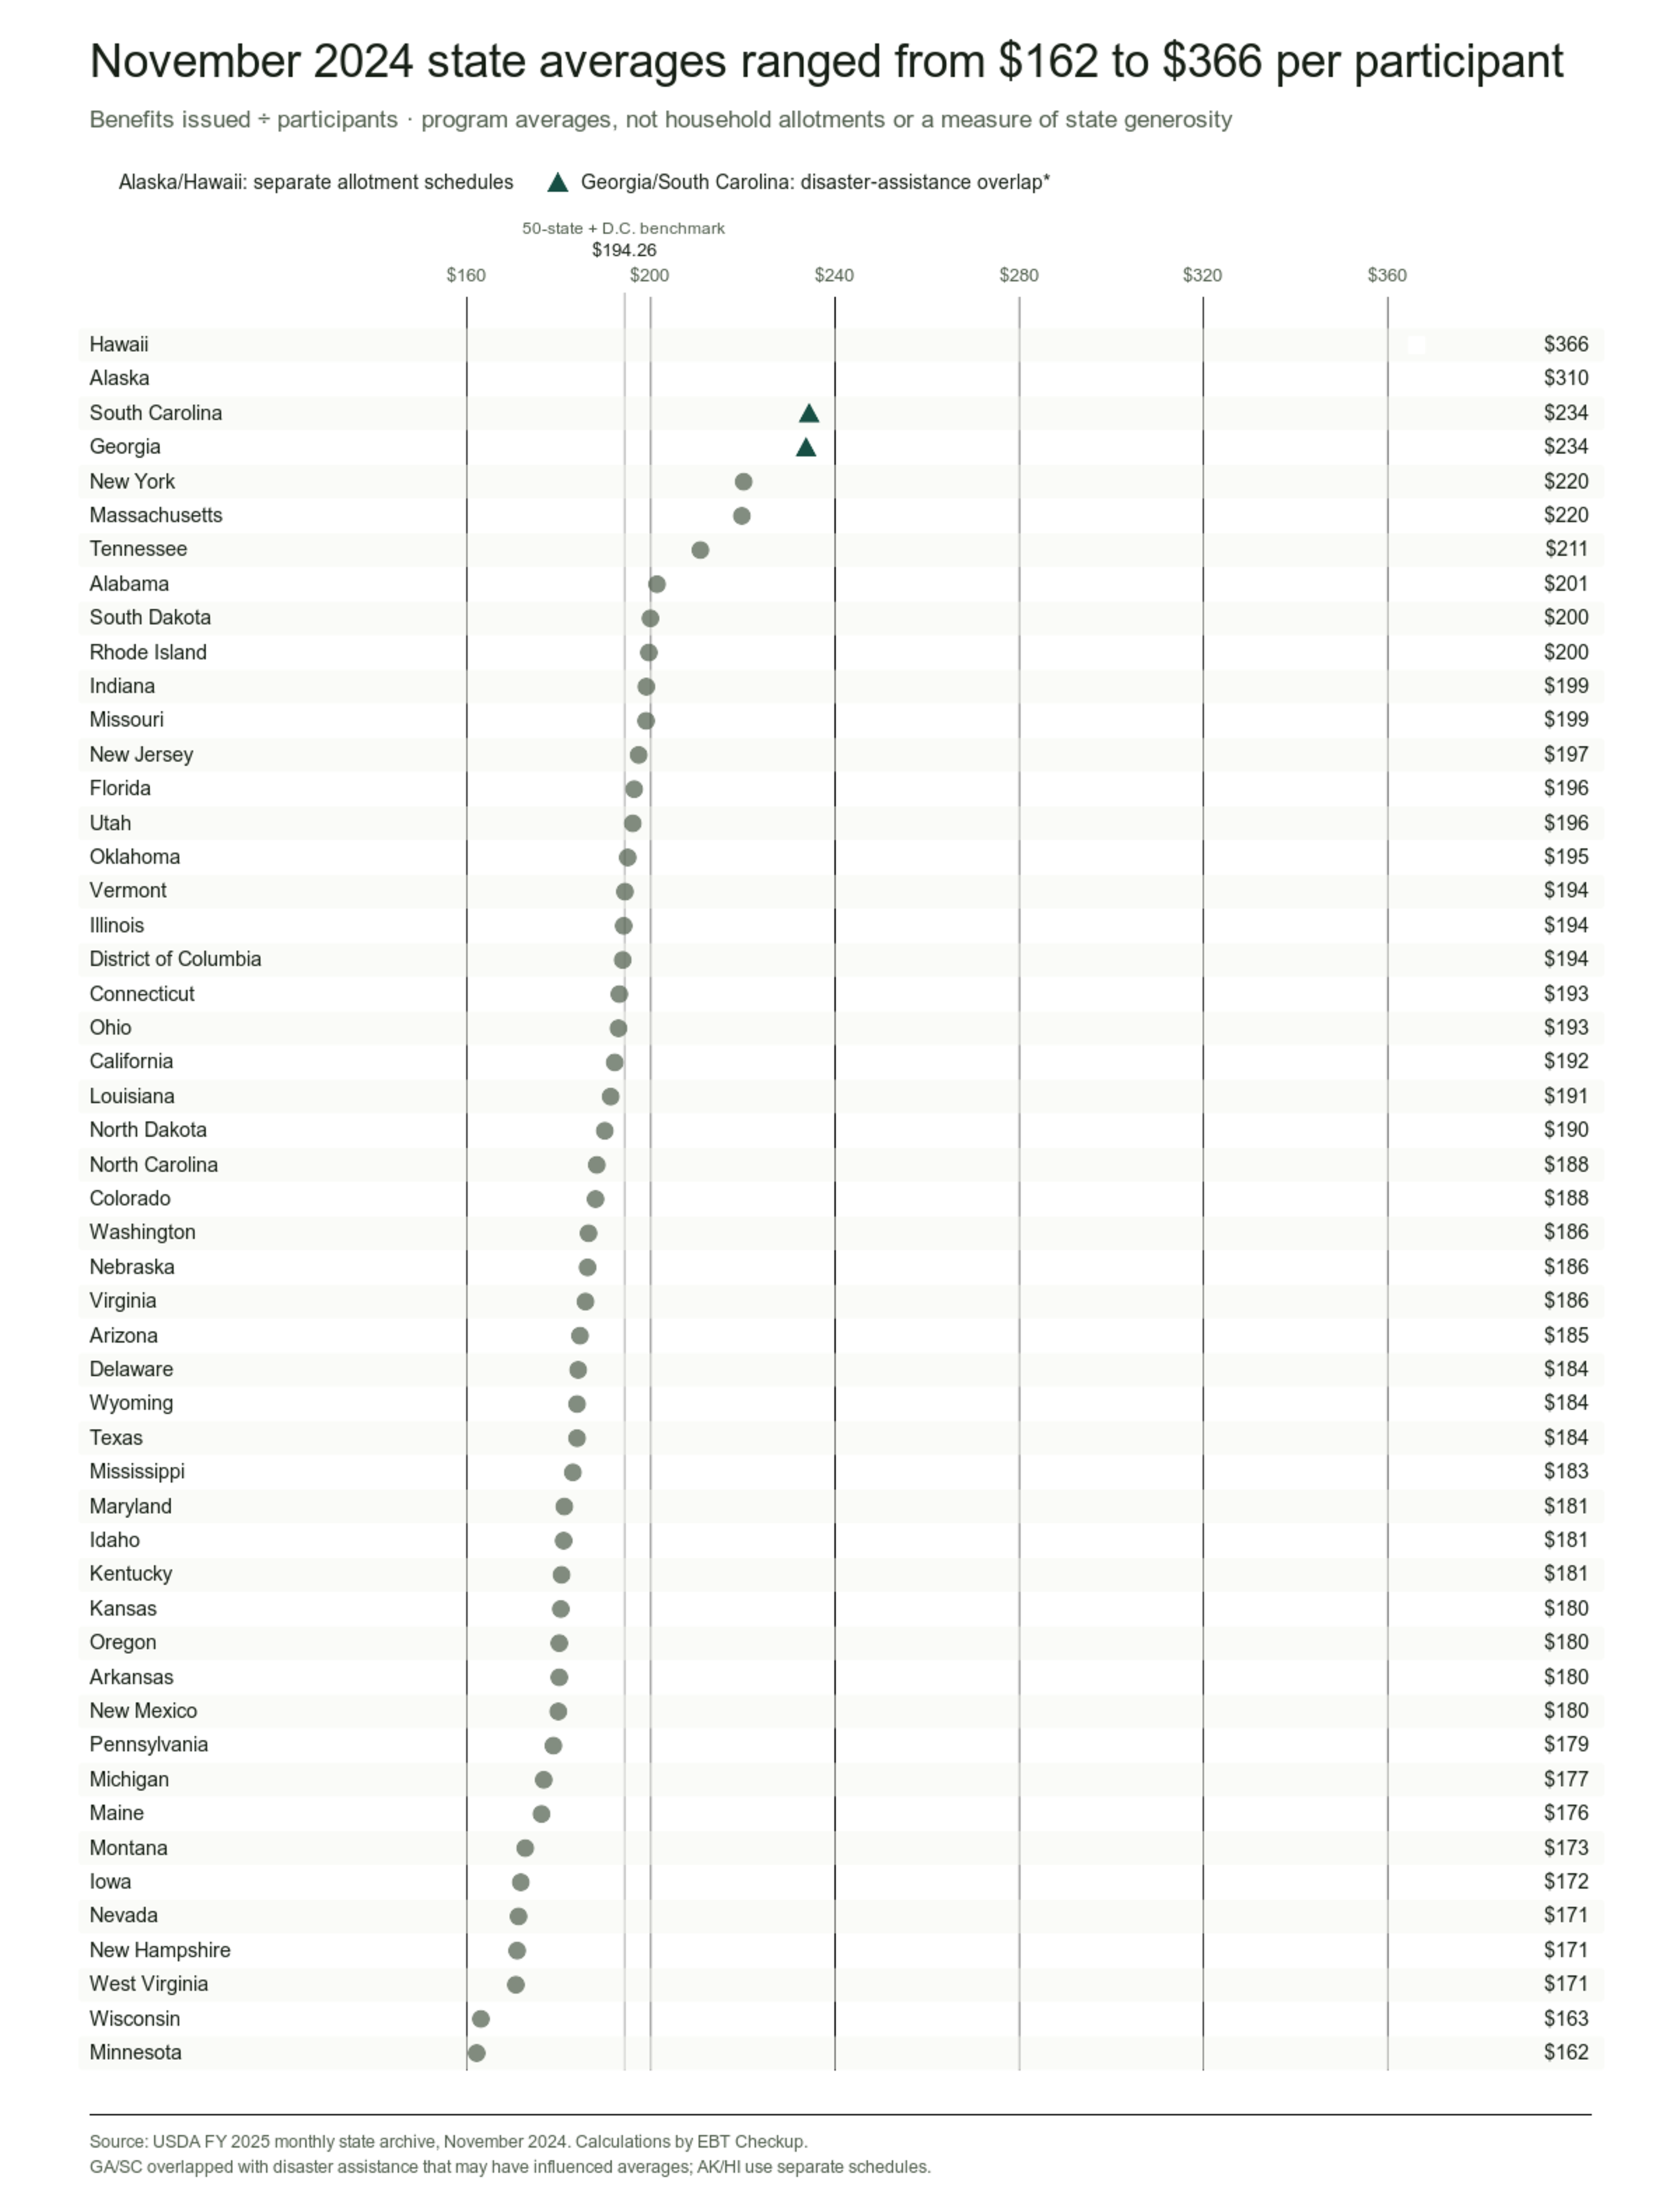
For state comparisons, use the final column; participant and benefit totals are included so the calculation can be checked.
| State | Participants | Benefits issued | Derived benefit per participant |
|---|---|---|---|
| Alabama | 752,271 | $151,461,311 | $201 |
| Alaska | 63,590 | $19,699,300 | $310 |
| Arizona | 906,998 | $167,438,903 | $185 |
| Arkansas | 234,948 | $42,311,859 | $180 |
| California | 5,485,613 | $1,053,988,922 | $192 |
| Colorado | 612,375 | $115,103,374 | $188 |
| Connecticut | 386,771 | $74,702,664 | $193 |
| Delaware | 121,912 | $22,457,684 | $184 |
| District of Columbia | 141,742 | $27,479,964 | $194 |
| Florida | 3,441,512 | $675,853,578 | $196 |
| Georgia | 1,505,645 | $351,875,566 | $234 |
| Hawaii | 158,425 | $58,033,880 | $366 |
| Idaho | 133,304 | $24,134,729 | $181 |
| Illinois | 1,938,206 | $376,186,890 | $194 |
| Indiana | 609,255 | $121,254,528 | $199 |
| Iowa | 262,559 | $45,094,982 | $172 |
| Kansas | 188,811 | $34,067,918 | $180 |
| Kentucky | 586,513 | $105,919,607 | $181 |
| Louisiana | 858,285 | $164,148,775 | $191 |
| Maine | 172,548 | $30,409,479 | $176 |
| Maryland | 688,786 | $124,815,566 | $181 |
| Massachusetts | 1,107,342 | $243,322,599 | $220 |
| Michigan | 1,462,020 | $258,361,210 | $177 |
| Minnesota | 455,500 | $73,864,556 | $162 |
| Mississippi | 377,826 | $69,163,850 | $183 |
| Missouri | 670,282 | $133,345,545 | $199 |
| Montana | 79,720 | $13,768,936 | $173 |
| Nebraska | 152,809 | $28,458,627 | $186 |
| Nevada | 508,396 | $87,070,511 | $171 |
| New Hampshire | 76,135 | $13,015,295 | $171 |
| New Jersey | 844,222 | $166,588,455 | $197 |
| New Mexico | 478,646 | $86,106,069 | $180 |
| New York | 2,968,440 | $653,500,076 | $220 |
| North Carolina | 1,498,341 | $282,052,357 | $188 |
| North Dakota | 52,264 | $9,929,297 | $190 |
| Ohio | 1,416,662 | $273,360,233 | $193 |
| Oklahoma | 702,750 | $137,012,226 | $195 |
| Oregon | 769,943 | $138,676,833 | $180 |
| Pennsylvania | 2,000,036 | $357,666,368 | $179 |
| Rhode Island | 144,210 | $28,779,542 | $200 |
| South Carolina | 701,330 | $164,372,068 | $234 |
| South Dakota | 75,220 | $15,035,061 | $200 |
| Tennessee | 689,477 | $145,312,890 | $211 |
| Texas | 3,499,384 | $643,724,503 | $184 |
| Utah | 176,692 | $34,645,316 | $196 |
| Vermont | 65,345 | $12,700,076 | $194 |
| Virginia | 835,451 | $155,219,784 | $186 |
| Washington | 900,844 | $167,958,047 | $186 |
| West Virginia | 273,522 | $46,680,273 | $171 |
| Wisconsin | 698,943 | $113,974,858 | $163 |
| Wyoming | 28,251 | $5,196,982 | $184 |
Source: USDA's November 2024 rows in the FY 2025 workbook within its monthly state participation and benefit data archive, with data as of July 10, 2026. The reproducible state transcription and calculation are available as a CSV download. Values are calculated as benefits issued divided by participants.
Looking for local next steps rather than an average? Use the state directory to find your state's estimated reload dates and reviewed official EBT account-access information.
Dividing the combined November 2024 benefit total for the 50 states and District of Columbia by their combined participant count produces $194.26 per participant. That is higher than both the FY 2025 annual average of $188.33 and the FY 2024 annual average of $186.76. These figures are not directly comparable because November 2024 is a one-month snapshot, while each fiscal-year figure averages 12 months and the snapshot may reflect temporary issuance described below.
Historical regional and metro food-price normalization
Food prices also vary by place. For an illustrative regional correction, we grouped the November 2024 state data into Census regions and divided each region's total benefits by its total participants. We then normalized those averages with price factors derived from USDA Economic Research Service's 2018 Food-at-Home Monthly Area Prices (F-MAP) data. Unlike CPI, F-MAP's price indexes are designed for comparisons across areas.
We built a broad food-at-home index from 89 F-MAP food groups, excluding alcohol, and set the national level to 100. This is an illustrative constructed index rather than a fixed common basket: each area-month uses its own purchase shares, so differences can reflect basket mix as well as prices. The calculation is: normalized benchmark = November 2024 benefit per participant ÷ 2018 geographic price factor.
| Census region | 2018 constructed food-at-home index (U.S. = 100) | Nov. 2024 nominal benefit per participant | 2018-price-factor-normalized benchmark |
|---|---|---|---|
| Northeast | 103.46 | $203.56 | $196.76 |
| Midwest | 98.46 | $185.77 | $188.67 |
| South | 99.20 | $195.74 | $197.32 |
| West | 101.35 | $191.39 | $188.85 |
Using this historical benchmark, the highest-to-lowest regional spread narrows mechanically from $17.79 to $8.65 per participant. The regional calculations are available as a CSV download. This does not show that food prices caused the original gap or that SNAP fully offsets regional food costs. The benefit totals still reflect household mix and disaster issuance, while the price factors describe four broad regions in 2018—not state or local prices in November 2024.
The normalized amounts remain November 2024 nominal dollars. We apply only the 2018 geographic price relationships; we do not convert the November 2024 amounts into 2018 dollars.
The South figure should be read with the detailed disaster-assistance note below in mind. The West includes Alaska and Hawaii to match F-MAP's Census-region geography, but those states use separate SNAP allotment schedules. The food groups and purchase-share weights also reflect food bought by all consumers rather than a perfect basket of SNAP-eligible purchases; for example, the mixed vitamins-and-meal-supplements category can contain both eligible food and ineligible supplements. This is a focused food-price normalization, not a complete cost-of-living adjustment; it says nothing about housing, transportation, utilities, or other household costs.
A historical metro food-price comparison
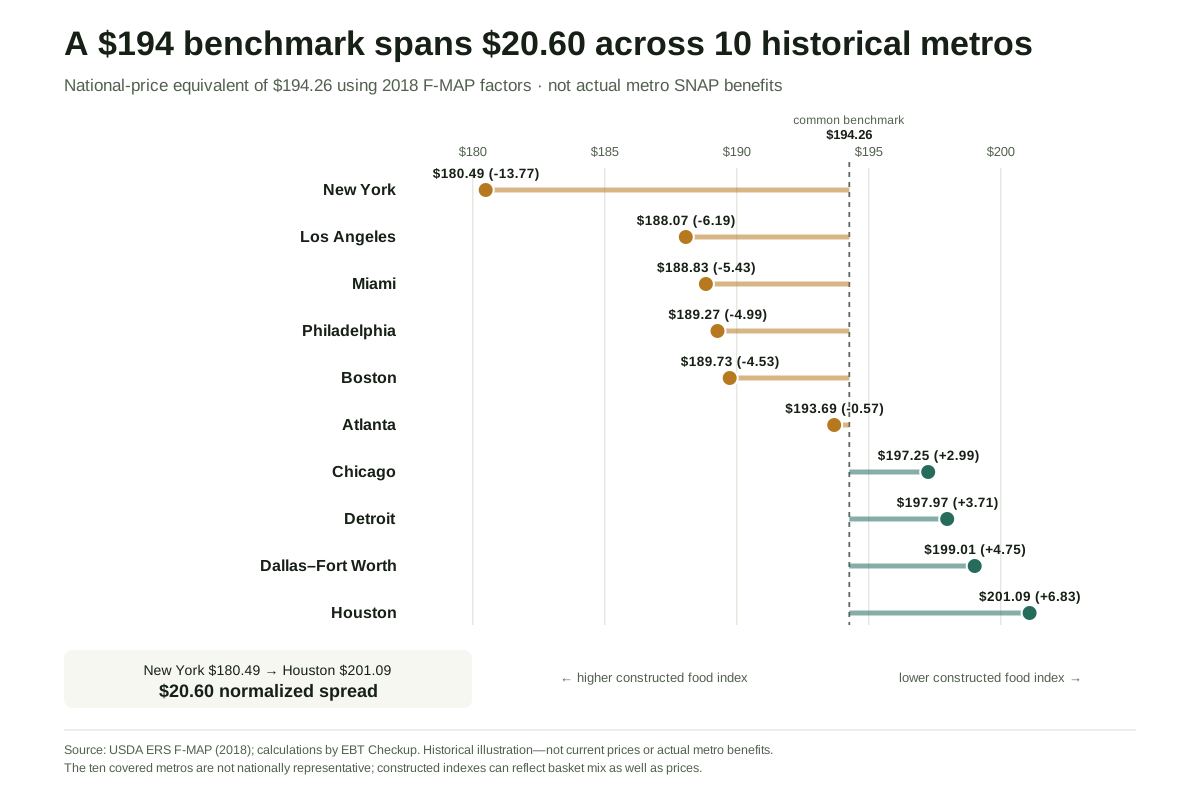
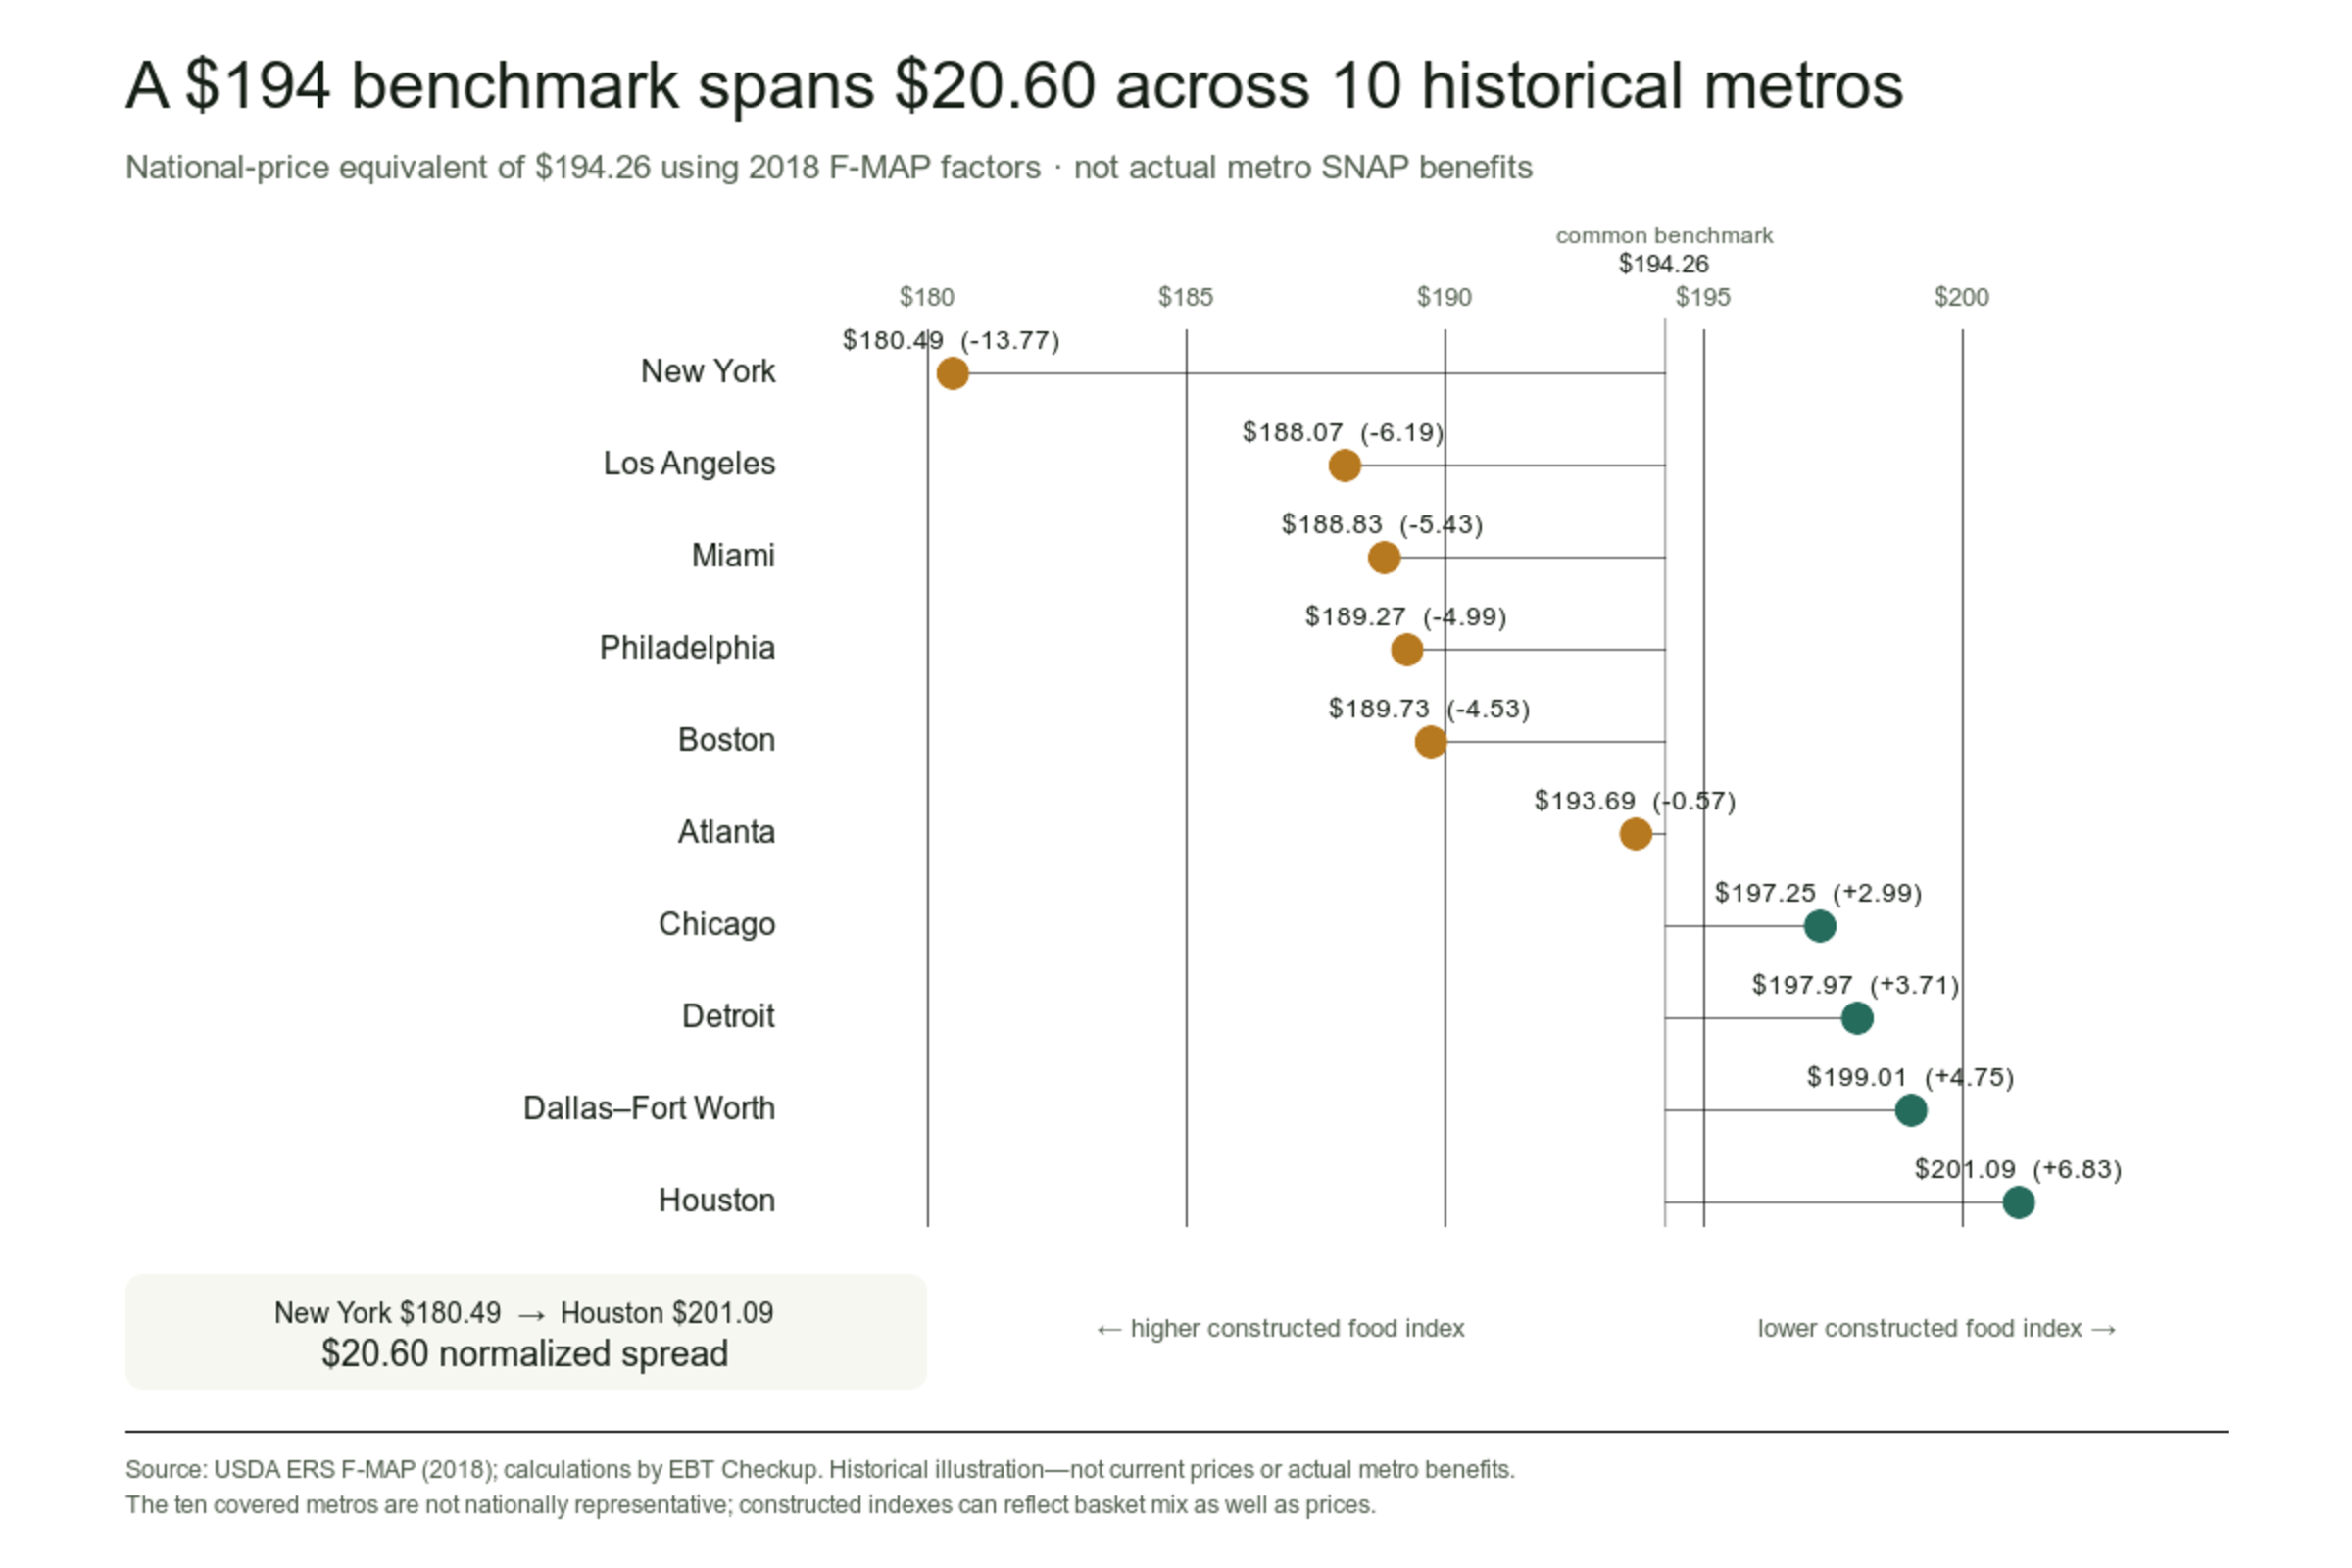
Broad regions can still feel abstract, so we ran the same index method for all ten metropolitan areas included in F-MAP. USDA's benefit tables do not report matching metro-level benefit totals. Instead, every row starts with the same $194.26 participant-weighted November 2024 benchmark—combined benefits divided by combined participants for the 50 states and D.C.—and applies the metro's 2018 index factor.

| Metro area | Principal-city region | 2018 constructed food-at-home index (U.S. = 100) | Illustrative national-price equivalent of $194.26 benchmark |
|---|---|---|---|
| New York | Northeast | 107.63 | $180.49 |
| Los Angeles | West | 103.29 | $188.07 |
| Miami | South | 102.88 | $188.83 |
| Philadelphia | Northeast | 102.64 | $189.27 |
| Boston | Northeast | 102.39 | $189.73 |
| Atlanta | South | 100.29 | $193.69 |
| Chicago | Midwest | 98.48 | $197.25 |
| Detroit | Midwest | 98.13 | $197.97 |
| Dallas–Fort Worth | South | 97.61 | $199.01 |
| Houston | South | 96.60 | $201.09 |
Among these ten covered metros, the 2018 index factors normalize the $194.26 benchmark mechanically to $180.49 in the New York metro and $201.09 in the Houston metro—a $20.60 spread in the normalized benchmark.
The limited set shows no simple regional divide: all three Northeast metros are above the national index; Chicago and Detroit are slightly below; the South includes higher-index Miami and lower-index Dallas and Houston; and Los Angeles is the only Western observation.
These are historical comparisons, not actual metro SNAP benefit averages and not estimates of today's grocery costs. The ten metros are the complete F-MAP metro set, but they are not nationally representative and do not represent rural areas or smaller metros. Coverage is uneven: Los Angeles is the only Western metro, and no metro in the Mountain West or Pacific Northwest is included. The region label follows each metro's principal city; some official metro definitions cross regional boundaries.
Why some state averages are much higher
The table should not be read as a scorecard of which state is “most generous.” SNAP benefits are federally funded and calculated under federal rules, although states administer the program and exercise some policy options. At least four factors can produce large differences in a state snapshot.
Alaska and Hawaii use different allotment levels
Food costs and program standards differ outside the 48 contiguous states. USDA publishes separate maximum allotments for Alaska and Hawaii. For FY 2026, for example, the maximum for a one-person household is $298 in the 48 states and D.C., compared with $385 in urban Alaska, as much as $598 in some rural Alaska areas, and $506 in Hawaii. These FY 2026 figures illustrate the continuing geographic differences but were not used to calculate the November 2024 averages. Those separate schedules help explain why Alaska and Hawaii stand out in the state table. See USDA's current SNAP cost-of-living adjustment tables.
November 2024 overlapped with disaster assistance
USDA warns that its monthly state tables may include disaster assistance. That matters particularly for this snapshot. Following Hurricane Helene, USDA approved a Disaster Supplemental Nutrition Assistance Program operation covering 28 South Carolina counties and one Indian reservation beginning in November 2024. It also approved phased D-SNAP operations across 55 Georgia counties, with some application periods running into November. See USDA's disaster records for South Carolina and Georgia.
These temporary issuances may have contributed to the elevated Georgia and South Carolina averages. That is an inference from the timing of the programs and the monthly totals, not a USDA decomposition of the figures.
Household circumstances affect the calculation
SNAP does not give every participant the average. USDA generally calculates a household's allotment by starting with the maximum for its household size and subtracting about 30% of its net monthly income. Allowable deductions—including certain shelter, dependent-care, child-support, and medical expenses—can change net income. See USDA's SNAP eligibility and benefit calculation explanation.
As a result, two households of the same size in the same state may receive different amounts. A household with little or no countable net income may receive the maximum, while another eligible household may receive much less.
The participating population is different in every state
State averages also depend on the households represented in the caseload. Household size, income, age, disability, and other circumstances differ. USDA's FY 2023 household study found that the average participating household received $332 per month, or $177 per person. Households with children received $574 on average because they contained more people, while their per-person average was $174. See Characteristics of SNAP Households: Fiscal Year 2023.
That distinction is why “average benefit per household” and “average benefit per person” should never be used interchangeably.
What this average cannot tell you
The figures above cannot determine:
- Whether you are eligible for SNAP
- The amount your state agency should approve for your household
- Your current EBT balance or pending deposit
- Whether a recent case change has been processed
- Whether disaster benefits or a replacement issuance apply to you
Only your state SNAP agency can make an eligibility or allotment determination. To see what has actually reached your card, use an official EBT portal, app, receipt, or customer-service number. Never share your EBT card number or PIN with an unofficial website, caller, or message sender. Our guides explain how to check an EBT balance safely, how EBT reload timing works, what SNAP can buy, and why EBT benefits may be late. Our state pages link to estimated reload dates and reviewed official account-access information where available.
Data downloads
The article's calculations and source transcriptions are available as reusable files:
- Annual SNAP participation and cost inputs (CSV)
- Monthly BLS food-at-home CPI inputs (CSV)
- Inflation-adjusted benefit calculations (CSV)
- November 2024 state snapshot (CSV)
- Regional food-price normalization (CSV)
- Metro food-price benchmarks (CSV)
- Methodology, source versions, and limitations (Markdown)
Methodology
For the national trend, we transcribed USDA's annual participation-and-cost table and retained the agency's units: average monthly participants, average monthly benefit per person, and total benefits during each federal fiscal year. The long-run comparison starts with FY 2019 because it is the last complete federal fiscal year before the COVID-19 pandemic; FY 2020 spans October 2019 through September 2020 and includes pandemic months.
For the inflation calculation, we used the unadjusted U.S. city average CPI-U food-at-home series CUUR0000SAF11. We averaged its October-through-September observations for each federal fiscal year, then multiplied each nominal benefit by FY 2025 CPI / that year's CPI. This converts the earlier average benefits to FY 2025 food-at-home dollars. The underlying monthly observations, fiscal-year inputs, and calculations are available as CSV files.
For the state comparison, we transcribed each state's November 2024 participant count and benefit total from USDA's completed FY 2025 monthly workbook, current as of July 10, 2026. We divided benefits by participants and rounded the result to the nearest dollar. We included all 50 states and the District of Columbia, but omitted Guam and the U.S. Virgin Islands from the displayed state table. Puerto Rico, American Samoa, and the Northern Mariana Islands receive Nutrition Assistance Grants rather than SNAP and are not part of these state comparisons.
For the regional and metro food-price calculations, we used F-MAP's 2018 weighted GEKS price indexes and weighted purchase dollars. Put simply, these are area-level food-category price comparisons that we combined according to the share of spending in each category. For each area and month, we combined 89 food groups into a Stone index by taking the purchase-share-weighted geometric mean of their price indexes. Each area-month uses its own purchase shares, so the constructed indexes can reflect basket mix as well as price. We excluded alcohol, averaged the 12 monthly results, and divided each area index by the national index. For regions, we divided the November 2024 regional benefit by the regional price factor. Each regional benefit aggregate uses the same Census-region geography as its F-MAP factor, including Alaska and Hawaii in the West.
For metros, no matching benefit aggregate was available. We therefore divided the same displayed $194.26 national benchmark by each metro factor. F-MAP's official metropolitan definitions are retained in the supporting CSV; shortened names appear in the article table for readability.
We chose a single month for the state and regional snapshots so each numerator and denominator covered the same period. We did not treat any derived value as a household benefit or adjust the state or regional benefit aggregates for household size, disaster issuance, participant characteristics, or within-region variation. The metro table is a separate benchmark illustration and uses no metro-level benefit totals. Those limitations are central to interpreting the results.
Data and calculations checked July 19, 2026. This article is informational and is not affiliated with USDA or any state SNAP agency.